
UN numbers showing world birth rates broken down by degree of development over 50 years. The vertical axis is birth rate per woman; the horizontal axis is the years in question. The world experience has been broken down into three different zones.
Fig. 26 7
The numbers cover the fifty years up to 2005. I am not exactly sure how they handled the fact that countries can become more developed or less developed relative to each other over time and whether they moved countries from one group to another group. Status conscious as people are, I would assume a lot of countries wanted to be moved from least to middle or middle to most. How the UN resisted such pressure, I can’t guess, but I take them at their word.
The numbers were offered in tabular form. It was easy enough to copy the numbers and simply use a simple program to graph them. Approach this graph with great care; do not leap to conclusions. Notice the birth rate in the least developed countries between 1970 and 1980. If my eyes deceive me not, there is a slight blip in the otherwise smooth flowing lines. I imagine this is a tiny fluke produced by a change in the way they were handling numbers. I shall refer to that later. Also notice how wars, famines, epidemics, social interventions and bullying do not show up as visible irregularities. By eyeball statistics, they are all trivial. If something happened in the least developed world between 1970 and 1980, possibly the China One Child Policy, but that is at the end of the time period and would not have had a retro-active effect, it quickly reversed and the curve reverted to what it had been.
I suspect that it is not much of a surprise that the countries with the most babies are the countries that can least afford them. At the cost of belaboring a straw man, let me take up the cudgel again. You’ll remember that a celebrity I shall not name apparently looked at this and decided that the poorest, largely sub-Saharan African, not only had the most babies but when they became more prosperous did not lower their fertility as fast as the middling group did. I can accept that. Then he decided that it was because they were not as bright as the rest of us. That was mistake number one. I am not just being trendy here. Let me offer a personal anecdote.
My grandfather, according to family lore, made the highest grade-average of anybody who had graduated from his college; the record stood until he was eclipsed by both his sons. This grandfather, the kindest man I ever knew, was chatting once with a hired man, who used the word, “boliform.” When asked what it meant, the hired man said it was African for elephant, he being of African extraction. Well the story went to one of my brothers, who graduated in English from Harvard, and thence to me. Being of low suspicious mind compared with these other men, I cudgeled my brains for years. After all, there is not just one African language; they are countless. Then I got it. A bolus is a mouthful of food after it has been chewed and before it has been swallowed. Just as cruciform means shaped like a cross, boliform means a shapeless mass – not so bad a description of an elephant. Instead of explaining the hired man concocted the story to be polite.
I could give other examples of times when I was blessed with the same good manners, but since these are uncontrolled observations, they prove nothing. But it would take a mountain of evidence to persuade me that Blacks are not very intelligent.
Alas the celebrity compounded his error by flapping his yap. To say his reputation suffered would be an understatement. Had he manifested a bit of African courtesy he’d have kept his job and been more highly thought of to this day.
But the fact remains that the poorest have the most babies, and the temptation is real to think that the people in richer are being more responsible. Don’t buy into that. We know already that kinship issues alone determine fertility. Actually, folic acid does, too, be we shall not be getting to that for a long time. For now, let’s look more closely at the numbers we have seen. I have whimpered, and shall whimper again, that the notch we saw in the Danish statistics mocks me. I cannot fathom from an intuitive standpoint why is should be there. But this time within seconds of looking at the UN graph above I saw through to its secret.
Watch me closely here for we are about to do something to that graph I have not seen done elsewhere. Starting with the least developed countries in 1950, imagine we have copied it from there to, say, 1990. Then notice that the birth rate is about the same as the birth rate of middling developed countries in about 1970. So, jumping back to the 1970 birth rate in middle developed countries we start to copy again. Well might you protest that we are doing violence to the graph.
You would have every justification for your outrage. But I think you can agree that we are doing something I can describe objectively. Those numbers exist, and they are going nowhere. I do not see the UN deciding to go back to previous estimates and changing them. Also, the numbers are statistically robust. That original graph records, in broad stroke, everyone born in the last fifty years as of 2005. It represents, as it were, all the jelly beans. Few reproduce after the age of fifty. The entire future of the only scientifically known life capable of abstract reasoning in the universe is represented among those 3 simple lines. They climb, swoop, level and seem a bit random, but they are all you’ve got.
Now, continuing to copy the middle-developed countries, starting in 1970, we continue to copy until between 1990 and 2000. We make another break. Hold your objections; they are already noted. Jump back to the birth rate in the developed world in 1965, where it is about the same. Then continue copying out to 2005. You have a bunch of numbers. And we know what we do with numbers, we graph them.
The composite curve looks like this:
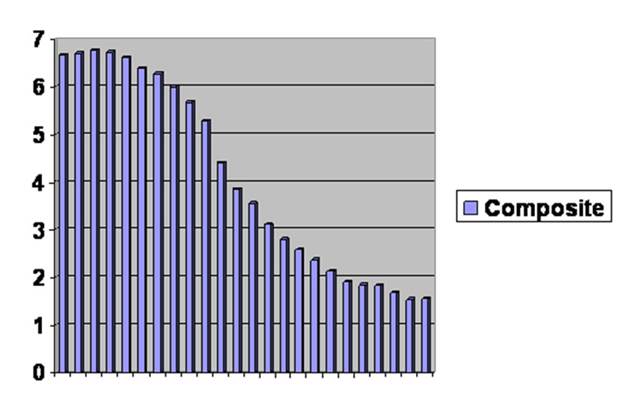
A composite of selected parts of figure 24. Births per woman are on the vertical axis. Years are on the horizontal axis. There are two places where the original graph was broken and spliced.
Fig. 25 8
It’s all the same curve. You can’t even tell where the edits are. Remember where that little blip was around the time of the One Child Policy. The blip is still there to be seen. But I for one cannot tell where the line goes from describing the least developed world to middle nor thence onto the most developed.
Don’t let anybody tell you there is a serious difference between groups of people. So far as fertility goes, we are all riding down the same slope, just separated in time.
Don’t buy into the notion that the rich world has stabilized. We have been below replacement for 30 years. Since there is no evidence I know of that the rich world has begun marrying cousins, the low fertility must persist. It may go to zero, but with current mating strategy it cannot go back up.
That is the heart of the chapter. We shall now go on and expand a bit.
Examining the final curve, a couple of things emerge. One is that the curve is exquisitely smooth. There cannot be a lot of mechanisms controlling it. On the other hand, the line bends twice, so in all probability there are at least two mechanisms in play.
The underlying process must be a global retreat from marrying cousins. I used to have a friend, much older than I and whom I completely trusted on the basis of evidence I shall not enter, who spent some of his younger years doing essentially missionary medical work in Africa. He told me a sad story that he saw play out. A young woman in the tribe he was staying with wandered off for what was probably about a half an hour unsupervised. This was scandalous in the extreme, and the tribe was unable to decide what to do. They sent for a witch doctor to decide if she had misbehaved. That would have meant having sex outside tribal orders. The witch doctor performed a rather simple ritual, the details of which you need not know, and then announced that if she was innocent, she would be fine. If she had done wrong, she would die. A few hours later she was dead. I figure this all took place somewhere around 1950 to 1970 reckoning from my friend’s age.
At that time, Africa had a more than adequate birth rate. The terrible means by which they maintained it was successful. Tribes by and large were able to maintain there genetic/epigenetic integrity with resulting healthy fertility, or at least high fertility. Then things started to go wrong. If you hear, “There are too many babies in the world,” make mental note that the person has said, “There are too many Black babies in the world.”
All right, we take as given that the mechanisms that govern the final line are pre-zygotic infertility and post-zygotic infertility, both brought on by outbreeding.
As of about 1975, the rate began to drop. Using the second graph, it dropped below replacement after about fifty years. This must have been due to pre-zygotic infertility, since pre-zygotic infertility must precede post-zygotic infertility. Pre-zygotic infertility does not result in absolute infertility. The selective advantage of this is obvious. Consider a well although not absolutely isolated population. Left to its own, it will remain constant in size. Then another population has an advantageous genetic mutation. It would be of benefit to the original population to get it into the genome. If pre-zygotic infertility were absolute, it is unlikely that that mutation, carried by an outsider, could become established. Admitting just one outsider from time to time would entail a fertility cost, but not an insurmountable one.
The combination pre-zygotic and post-zygotic infertility could, however, lead to extinction. If it takes fifty years for the pre-zygotic infertility to spread to all of a population, then it might well take fifty years for post-zygotic infertility to do the same. The most-developed world dropped below replacement in about 1975 and fell a bit more until 1995. Adding each of those numbers to fifty, and we get 2025 and 2045.
Somewhere in that range, the developed world should have a fertility drop to zero. I should imagine that the countries will experience this catastrophic drop, one by one, over that period time. Of course, it would not proceed by country. Most countries are, at least to a degree, stratified. It would be the productive middle class of the world that would stop having babies, to the great disadvantage of civilization. The last woman who will ever have a middle-class baby might now be 35.
The middling world is about 35 years behind. The woman to be the last mother in the middle-developed world is already a baby. The least developed world is twenty more years back. Lots can happen in twenty years, but by and large her parents are already married; her genetic and epigenetic makeup are in essence already fixed.
If you can figure a way out of this doom, you are more intelligent than I. It has taken all my life and all my strength to get this far. I just pray that my numbers are far off.